Power BI · Data Analytics · UAE 2026
What Is DAX in Power BI? A Complete Beginner's Guide (2026)
By Alifbyte Editorial Team
10 min read
Updated: May 2026
Beginner–Intermediate
Introduction: Why DAX in Power BI Matters in 2026
You open Power BI for the first time. The interface looks polished, the visuals are impressive — and then someone mentions DAX. Suddenly, the room goes quiet. If you're a beginner or a working professional in the UAE exploring data analytics, you've probably wondered: what exactly is DAX in Power BI, and why does everyone keep talking about it?
Here's the honest truth: skipping DAX means staying stuck at surface-level reporting. Without it, you're limited to basic drag-and-drop charts that any junior analyst can produce. With DAX (Data Analysis Expressions), you can build dynamic calculations, uncover deep business insights, and become the person in the room who can actually answer the hard questions from management. In the UAE's fast-growing business intelligence market, that skill gap translates directly into higher salaries and more career opportunities.
This guide breaks down everything you need to know — from what DAX is and where it's used, to key functions, comparison tables, and a step-by-step learning roadmap specifically for professionals in Dubai and across the UAE.

What Is DAX in Power BI? (And Where Is It Used?)
DAX stands for Data Analysis Expressions. It is a formula language developed by Microsoft that allows users to perform advanced calculations and data analysis inside Power BI, Power Pivot in Excel, and SQL Server Analysis Services (SSAS).
Think of what is DAX in Power BI this way: while the Power BI visual interface lets you drag and drop charts and graphs, DAX defines what those charts actually measure. Things like year-over-year revenue growth, running totals, profit margins, customer churn rates, and weighted averages — none of these exist out of the box. DAX is how you build them.
Where Is DAX Used Across the Microsoft Ecosystem?
- Power BI Desktop & Service — The primary and most popular platform for DAX. Almost every enterprise Power BI report relies on DAX measures for its KPIs and calculations.
- Power Pivot (Excel) — Allows advanced data modelling and DAX calculations directly inside Excel workbooks, bridging the gap between spreadsheet analysis and full BI tools.
- SQL Server Analysis Services (SSAS) — Tabular Mode — Used in enterprise-grade analytical models for large-scale data processing. The same DAX formulas you write in Power BI work here.
- Azure Analysis Services — Microsoft's cloud-hosted analytical service that uses the same DAX engine, enabling scalable BI for cloud-first organisations.
Key Insight for UAE Professionals
DAX is not just a Power BI skill — it is a cross-platform analytical language that works across the entire Microsoft data stack. Learning DAX once means you can contribute to Power BI projects, Excel data models, and enterprise SSAS solutions — making it one of the most transferable skills in business intelligence UAE today.

DAX Calculated Columns vs Measures: What's the Real Difference?
This is the question that trips up almost every beginner. Both are written in DAX, but they work fundamentally differently — and choosing the wrong one can quietly destroy your report's performance. Understanding DAX calculated columns vs measures is one of the most important early lessons in your Power BI journey.
What Is a Calculated Column?
A calculated column is evaluated row by row at data refresh time. The result is computed once and then stored permanently in your data model, consuming memory. Use calculated columns when you need a fixed, per-row value — such as assigning a discount tier to each product, computing a profit per transaction, or classifying customers into segments.
Example: Profit = Sales[Revenue] - Sales[Cost]
This formula runs once for every row in the Sales table and stores the result. You can then use this column to filter, group, or build relationships — but it does not respond to report-level filters dynamically.
What Is a Measure?
A measure is calculated dynamically at query time, responding to whatever slicers, filters, or visual-level selections are active in the report at that moment. Measures do not store data anywhere — they recalculate on the fly every time the filter context changes. This makes measures far more powerful and memory-efficient for business reporting.
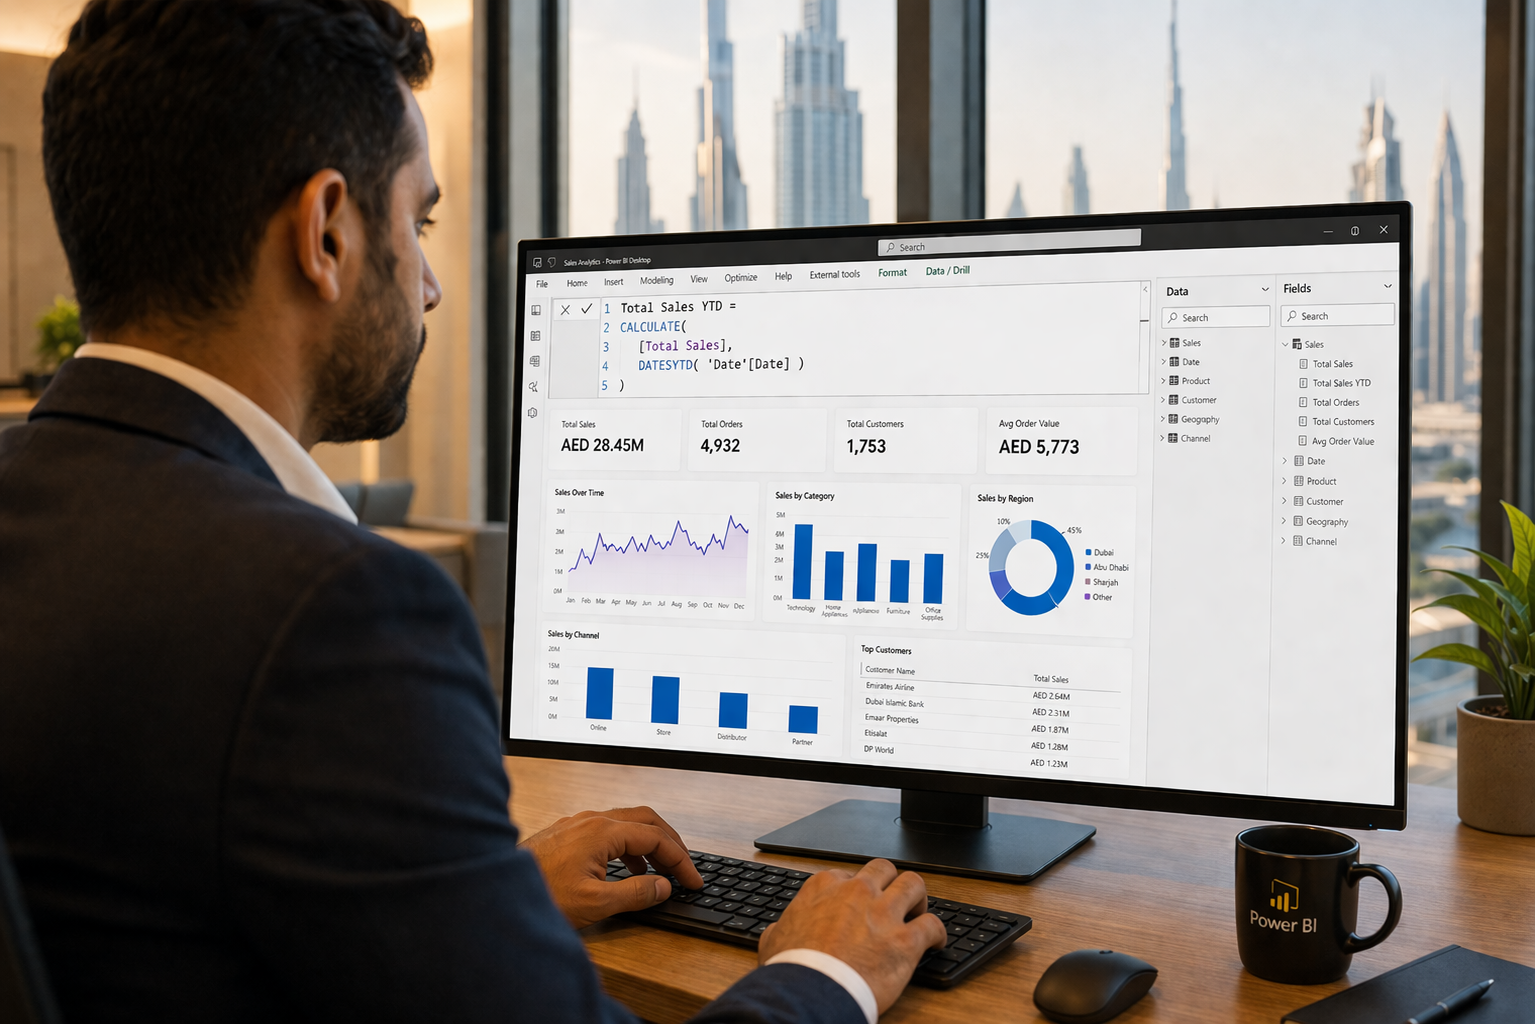
Example: Total Sales = SUM(Sales[Revenue])
When a user selects "Dubai" on a slicer, this measure automatically recalculates to show only Dubai's revenue. Change the slicer to "Abu Dhabi" and it recalculates instantly. That dynamic behaviour is what makes Power BI dashboards truly interactive.
| Feature | Calculated Column | Measure |
|---|
| Evaluated when | At data refresh (stored) | At query / visual render time |
| Stored in model? | Yes — uses memory & disk | No — computed on demand |
| Context awareness | Row context only | Full filter context (dynamic) |
| Best used for | Static row-level categories, segments | KPIs, aggregations, dynamic totals |
| Performance impact | Higher — adds to model size | Lower — no storage overhead |
| Can use in visuals? | Yes (as axis, legend, slicer) | Yes (as value field only) |
| Quick example | Profit = Revenue - Cost | Total Sales = SUM(Revenue) |
Pro Tip from Alifbyte Instructors
As a general rule: default to measures for almost everything. Use calculated columns only when you genuinely need a per-row value for filtering, grouping, or establishing table relationships. A model built primarily on measures will be faster, leaner, and far easier to maintain as your reports scale.
Top 10 DAX Functions for Beginners (Quick-Reference Table)
Before diving into a Power BI course in Dubai, it's worth getting familiar with the most commonly used DAX functions list every beginner needs to know. These ten functions cover the vast majority of real-world use cases you'll encounter in business reporting:
| Function | Category | What It Does | Example |
|---|
SUM | Aggregation | Adds all values in a column | SUM(Sales[Revenue]) |
CALCULATE | Context Modifier | Evaluates an expression with modified filters — the most powerful DAX function | CALCULATE(SUM(Sales[Revenue]), Region="Dubai") |
FILTER | Table Function | Returns a filtered subset of a table based on a condition | FILTER(Sales, Sales[Amount] > 1000) |
IF | Logical | Returns one value if a condition is true, another if false | IF(Sales[Profit] > 0, "Profit", "Loss") |
RELATED | Relationship | Retrieves a value from a related table via a defined relationship | RELATED(Product[Category]) |
COUNTROWS | Counting | Counts the number of rows in a table or filtered table | COUNTROWS(Orders) |
DIVIDE | Math | Safe division that gracefully handles divide-by-zero errors | DIVIDE([Profit], [Revenue], 0) |
ALL | Context Modifier | Removes all active filters from a column or table | ALL(Sales[Region]) |
VALUES | Table Function | Returns a one-column table of distinct values, respecting filter context | VALUES(Product[Category]) |
COUNTA | Counting | Counts all non-blank values in a column (text and numbers) | COUNTA(Customers[Email]) |
Once you've practised these through a structured Power BI DAX tutorial, you'll be ready to tackle more advanced patterns like time intelligence functions (SAMEPERIODLASTYEAR, DATEADD) and iterator functions (SUMX, AVERAGEX).

DAX vs Excel Formulas: Key Differences Explained
Many professionals across the UAE arrive at Power BI with years of Excel experience. That background is genuinely useful — but it can also create confusion if you expect DAX vs Excel formulas to behave the same way. They don't. Here's a clear comparison to help you build on what you know while avoiding common mistakes:
| Aspect | Excel Formulas | DAX Formulas |
|---|
| Operates on | Individual cells or ranges (e.g. A1:B10) | Entire columns and related tables |
| Reference style | Cell-level (A1, B2, $C$3) | Table[Column] notation |
| Data volume | Limited by worksheet rows (~1M) | Handles tens of millions of rows efficiently |
| Context awareness | Static — evaluates once per cell | Dynamic — responds to filter and row context |
| Time intelligence | Manual with OFFSET or helper columns | Built-in functions (SAMEPERIODLASTYEAR, DATEADD) |
| Dynamic filtering | Requires SUMIF, SUMIFS, or complex pivot logic | Native via CALCULATE + FILTER combination |
| Cross-table logic | Requires VLOOKUP, INDEX/MATCH | Native via relationships and RELATED |
| Best suited for | Ad-hoc analysis, smaller datasets | Enterprise BI, scalable dashboards |
If you're already confident with an Advanced Excel course, transitioning to DAX will feel familiar in terms of formula structure. However, the underlying logic — especially the concept of filter context — is fundamentally different and requires deliberate study.
Common Beginner Mistake
Trying to reference specific cells or rows in DAX (the way you would in Excel) is the most common mistake new learners make. DAX always operates on columns and tables — it has no concept of a single cell reference like A1 or B5. Embracing this distinction early saves hours of frustration.
What Are the Most Valuable Skills to Develop for a Successful Data Analytics Career?
What are the most valuable skills to develop for a successful data analytics career?
DAX is a crucial piece of the analytics puzzle, but it's one component in a larger professional skill set. For anyone serious about building a sustainable data analytics career — especially in the UAE — here are the skills that consistently appear at the top of employer requirements:
- Data Visualisation & Storytelling — Tools like Power BI are only effective when the reports they produce communicate insights clearly. Learning to design intuitive dashboards and present findings to non-technical stakeholders is as important as the formulas themselves.
- SQL Proficiency — The vast majority of enterprise data lives in relational databases. SQL remains the baseline querying language for any analyst, regardless of seniority level.
- Data Cleaning & Power Query — Garbage in, garbage out. Before any DAX formula runs, your data must be clean, structured, and reliable. Developing strong Power Query training skills makes your analysis trustworthy from the ground up.
- Statistical Thinking — Understanding distributions, correlations, and significance helps you move beyond describing what happened to explaining why it happened.
- Business Acumen — Data without business context is just numbers. The most effective analysts understand the commercial problems they're solving and can translate technical findings into business decisions.
- Communication Skills — Being able to present a complex analysis in a clear, compelling way is what separates good analysts from great ones in the eyes of leadership.
- Python or R (at least foundational level) — As data roles evolve, programming literacy is increasingly expected, particularly for automation, advanced modelling, and machine learning tasks.
You can begin building many of these skills through structured data analytics courses in UAE that combine tools, theory, and real-world projects designed around the UAE's business landscape.
Most In-Demand Skills in Data Analytics in UAE
Most in-demand skills in data analytics in UAE
The UAE's ambition to become a global knowledge economy — driven by initiatives like UAE Vision 2031 — has created surging employer demand for professionals who can work effectively with data. Hiring managers across Dubai, Abu Dhabi, Sharjah, and beyond are actively looking for candidates with these capabilities:
| Skill | Tools / Platforms | UAE Demand |
|---|
| Business Intelligence Reporting | Power BI, Tableau, Looker | Very High |
| DAX & Data Modelling | Power BI, SSAS, Azure | High |
| Data Cleaning & ETL | Power Query, Python, dbt | High |
| SQL & Database Querying | MySQL, SQL Server, PostgreSQL | Very High |
| Advanced Excel & Automation | MS Excel, VBA, Power Pivot | High |
| Machine Learning Fundamentals | Python, Azure ML, Scikit-learn | Growing |
| Cloud Data Platforms | Azure Synapse, AWS Redshift | Growing |
| Data Governance & Literacy | Microsoft Purview, internal policies | Stable |
Power BI training in Dubai has seen a notable surge in enrolments as the financial services, retail, real estate, healthcare, and government sectors accelerate their digital transformation efforts. Professionals who combine DAX proficiency with strong business intelligence UAE experience are commanding significantly higher salaries and faster career progression than their peers.
If you're considering a career shift or looking to level up your current role, pairing your Power BI skills with a Data Science and AI course will make your profile substantially more competitive in 2026 and beyond.
What Are the Crucial Tips to Enhance Your DAX Skills?
What are the crucial tips to enhance your DAX skills?
Tested Advice from Alifbyte's Power BI Instructors
These are the practical strategies that have helped hundreds of our students in Dubai and across the UAE go from complete DAX beginners to confident, job-ready Power BI analysts.
- Master filter context before anything else. Understanding how DAX "sees" data — and how slicers, page filters, and visual-level filters change what a measure calculates — is more important than memorising functions. Once filter context clicks, the logic behind most DAX patterns becomes intuitive.
- Practice on real datasets, not toy data. Theory stalls without practice. Download free business datasets from Kaggle or use anonymised data from your workplace. Building on real data surfaces the messy edge cases that tutorials always skip.
- Use DAX Studio for debugging. This free, standalone tool lets you test and benchmark DAX queries outside of Power BI. It shows you exactly what filters are active, what a measure returns, and where performance is degrading. It is indispensable for intermediate learners.
- Learn one function deeply, not ten shallowly. Spend a week understanding
CALCULATE inside-out — every modifier, every edge case — before moving on to the next function. CALCULATE is the foundation that all advanced DAX patterns are built upon. - Join the Power BI community forums. Microsoft's Power BI Community is one of the most active and helpful technical forums on the internet. Whatever problem you're facing, someone has almost certainly solved it and shared the solution.
- Audit your measures regularly. As reports grow more complex, DAX measures can become redundant, slow, or poorly named. Periodic clean-ups keep your model performant and your codebase maintainable.
- Enrol in structured training. Self-study is valuable but has real limits. Guided instruction from certified instructors compresses your learning curve, surfaces conceptual gaps earlier, and provides a structured path through increasingly complex topics.
How to Start Learning DAX in Power BI: A Step-by-Step Roadmap
Whether you are brand new to Power BI or a working professional in the UAE who has been putting off learning DAX, here is a practical, sequenced roadmap to learn DAX Power BI effectively — without overwhelm:
1
Get comfortable with Power BI Desktop first
Download the free Power BI Desktop app. Before writing a single DAX formula, learn how to import data, understand the three views (Report, Data, Model), and create basic visuals. DAX makes most sense when you have a working data model to experiment on.
2
Invest time in Power Query for data preparation
Clean, well-structured data is the foundation of reliable DAX. Before complex formulas can produce meaningful results, your raw data needs to be in the right shape. Investing in
Power Query training before diving deep into DAX will pay dividends throughout your entire Power BI career.
3
Write the ten core functions at least five times each
Use the quick-reference table above as your starting point. Write SUM, CALCULATE, IF, FILTER, COUNTROWS, DIVIDE, ALL, VALUES, RELATED, and COUNTA on real data — not just copy-paste. Repetition on actual business datasets builds muscle memory and contextual understanding far faster than reading alone.
4
Study filter context and row context deliberately
This is the conceptual leap that separates DAX beginners from intermediate users. Understand why the same measure can return different values depending on which slicer, visual, or page filter is active. Work through the CALCULATE function in detail — it is the gateway to filter context mastery.
5
Build one complete portfolio project from scratch
Choose a realistic business scenario — a sales performance dashboard, an HR headcount report, a financial P&L tracker — and build it entirely from scratch using DAX measures. Portfolio projects expose you to real challenges that no tutorial replicates. Sharing it on LinkedIn with a short write-up signals competence to UAE hiring managers immediately.
6
Enrol in a structured Power BI course with certified instructors
Guided, structured learning from experienced instructors shortens your learning curve dramatically. Alifbyte's
Power BI course in Dubai covers everything from DAX fundamentals through advanced time intelligence, with hands-on labs, real business datasets, and career-focused assessments designed for the UAE job market.
Frequently Asked Questions About DAX in Power BI
What is DAX in Power BI in simple terms? ▾
DAX (Data Analysis Expressions) is a formula language used in Power BI to create custom calculations and measures. Think of it as a supercharged version of Excel formulas — but designed to work across entire tables and data models, not individual cells. It allows you to build dynamic KPIs, year-over-year comparisons, running totals, and much more.
Is DAX difficult to learn for beginners? ▾
DAX has a learning curve, but it is not as steep as a full programming language like Python. If you have experience writing Excel formulas like SUMIF or VLOOKUP, you will find the syntax approachable. The main conceptual challenge is understanding filter context — once that clicks, most DAX patterns become intuitive. Structured training significantly accelerates this process.
What is the difference between DAX and M language in Power BI? ▾
M language (used in Power Query) is for data transformation and preparation — cleaning, shaping, merging, and loading data before it enters your model. DAX is used after the data is loaded, for creating calculations and analytical measures within the data model. Both are essential in a Power BI workflow, but they serve entirely different purposes and run at different stages of the pipeline.
Can I use DAX in Excel? ▾
Yes. DAX is available in Power Pivot, which is a built-in Excel add-in that enables data modelling and calculated fields within Excel workbooks. The syntax is nearly identical to Power BI DAX. If you're building advanced analytical models inside Excel, your Power BI DAX knowledge transfers directly — and vice versa.
What is the CALCULATE function in DAX and why is it so important? ▾
CALCULATE is arguably the most powerful and widely used function in DAX. It allows you to evaluate any expression while modifying the active filter context — meaning you can override which rows of data are included in a calculation. For example, you can calculate total sales for "Dubai" even when the entire report is filtered to show "Abu Dhabi" data. Almost every advanced DAX pattern relies on CALCULATE at its core.
How long does it take to learn DAX in Power BI? ▾
With consistent daily practice of 30–60 minutes, most beginners become comfortable with DAX fundamentals — SUM, CALCULATE, IF, FILTER — within 4–6 weeks. Reaching an intermediate level where you can confidently write time intelligence calculations and complex CALCULATE patterns typically takes 3–6 months. A structured course with experienced instructors compresses this timeline significantly.
Is Power BI and DAX knowledge useful for jobs in the UAE? ▾
Absolutely. Power BI and DAX proficiency rank among the most in-demand analytics skills in the UAE job market right now, particularly across financial services, retail, logistics, real estate, and government sectors. Professionals who can build scalable, insightful Power BI reports using DAX measures are consistently among the most hired and best-compensated analytics professionals in Dubai, Abu Dhabi, and Sharjah.
What DAX functions should every beginner learn first? ▾
The ten essential DAX functions for beginners are: SUM, CALCULATE, FILTER, IF, RELATED, COUNTROWS, DIVIDE, ALL, VALUES, and COUNTA. These cover aggregation, logical branching, filtering, cross-table lookups, and counting — the building blocks of virtually every real-world Power BI report you will ever build. Master these before exploring time intelligence or iterators.
Do I need coding experience to learn DAX? ▾
No coding background is required to start learning DAX. It is syntactically closer to Excel formulas than to programming languages like Python or JavaScript. What matters more than coding experience is logical thinking, a basic understanding of data tables and relationships, and the willingness to experiment with real data. Most analysts with solid Excel skills can begin writing basic DAX within their first week.
How is DAX different from SQL? ▾
SQL is a querying language used to retrieve, filter, and manipulate data stored in relational databases. DAX is a formula language used to define calculations within an already-loaded analytical data model. SQL gets data out of a database; DAX defines what to compute with that data inside Power BI. Many advanced analysts use both: SQL to extract and shape data at the source, DAX to build calculations and KPIs on top of the loaded model.
Where can I learn DAX in Power BI in Dubai or the UAE? ▾
Microsoft's official documentation and community forums are solid free resources. For structured, career-focused learning with certified instructors and real project experience, Alifbyte Education offers a comprehensive Power BI course in Dubai tailored to the UAE job market. The course covers everything from the DAX fundamentals covered in this guide through advanced analytics techniques — with hands-on labs and career support included.
Ready to Master DAX in Power BI?
Join hundreds of professionals across Dubai and the UAE who have transformed their data analytics careers with Alifbyte's hands-on, certified Power BI training. Learn DAX from scratch, build real dashboards on real business data, and gain skills that UAE employers are actively hiring for right now.
Enrol in Power BI Course in Dubai →Flexible schedules · Certified instructors · UAE-focused curriculum · Career support included