You know data skills matter — but which tool do you start with? Power BI or Excel? It sounds like a simple question, but the wrong answer can cost you months of misdirected effort and weaken your CV in a competitive UAE job market. Both tools are powerful, both are widely used across the UAE, and both are taught in professional data analytics programmes. But they are fundamentally different — and understanding that difference will help you build the right skills, in the right order, for the role you actually want.
Table of Contents
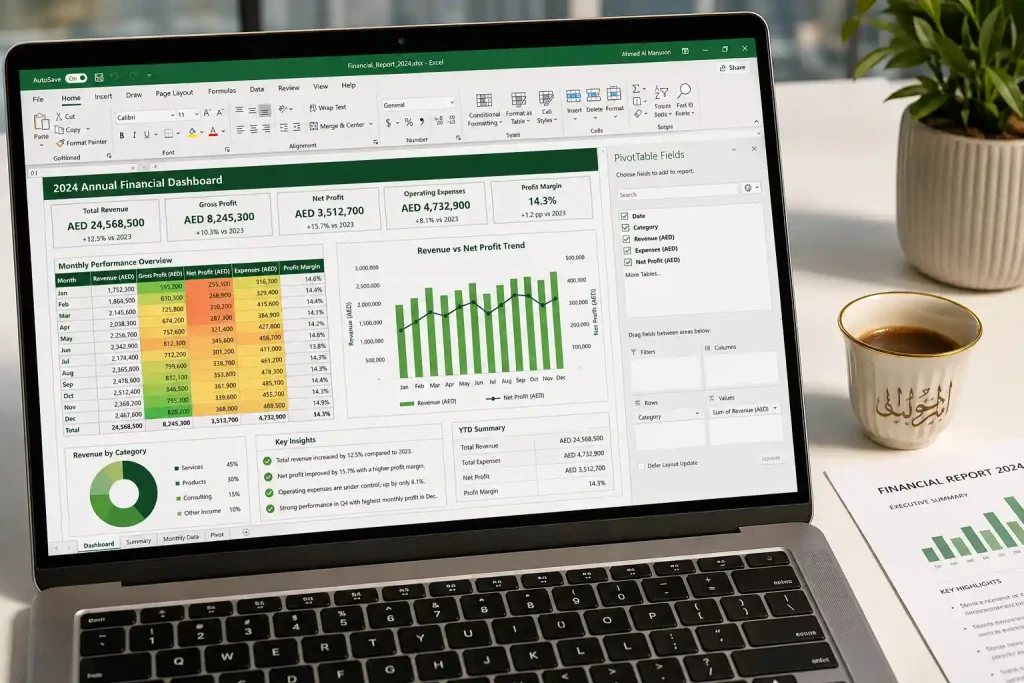
Microsoft Excel has been the world’s most widely used data tool for over three decades — and its grip on the UAE business world remains remarkably strong. From small family businesses in Deira to multinational finance teams in DIFC, Excel is the common language of data across virtually every sector and company size.
At a basic level, Excel is a spreadsheet application. But at an advanced level, it is a fully capable data analysis, modelling, and reporting tool. Advanced Excel users work with:
Here is the reality that many beginners overlook: Power BI was built on the same data modelling engine as Excel’s Power Pivot. If you understand Power Query and DAX in Excel, transitioning to Power BI becomes dramatically faster. Excel is not a stepping stone you tolerate before moving to “real” tools — it is the foundation that makes every advanced tool easier to learn. Start with Alifbyte’s MS Excel course to build that foundation properly.
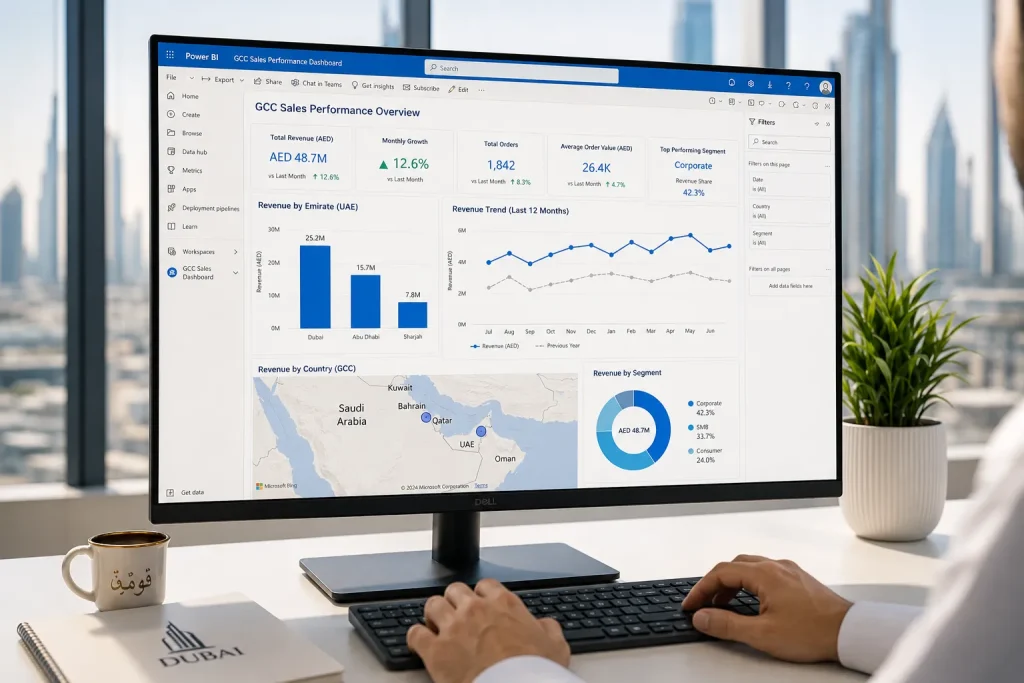
Power BI is Microsoft’s dedicated business intelligence and data visualisation platform. Released in 2015 and now deeply integrated into Microsoft 365, it is designed specifically for creating interactive dashboards, live reports, and organisation-wide data sharing — things Excel was never built to do at scale.
Power BI works in three connected environments:
What makes Power BI fundamentally different from Excel is its approach to live data connectivity, scale, and sharing. Power BI can connect directly to hundreds of data sources — SQL databases, Salesforce, Google Analytics, SharePoint, Azure, SAP, and more — and refresh automatically. A dashboard built in Power BI is a living document that updates in real time. An Excel report requires someone to manually update it every time.
For UAE professionals working in medium to large organisations, the Power BI course is increasingly the tool that differentiates a good analyst from a great one.
| Feature / Criteria | Microsoft Excel | Power BI |
|---|---|---|
| Primary purpose | Spreadsheet analysis, modelling, reporting | Business intelligence, interactive dashboards, data sharing |
| Data volume | Up to ~1 million rows (limited by worksheet) | Hundreds of millions of rows via compressed data model |
| Data sources | Files, databases (via connections), web queries | 300+ native connectors: SQL, cloud, APIs, ERP, CRM, and more |
| Interactivity | Limited (slicers, filters, form controls) | Fully interactive — cross-filtering, drill-through, bookmarks |
| Collaboration and sharing | File-sharing via email or SharePoint; version control issues | Cloud-first publishing; real-time shared workspaces; row-level security |
| Automatic refresh | Manual update required | Scheduled refresh up to 8 times/day on Pro; real-time on Premium |
| Calculation language | Cell-based formulas; Power Pivot uses DAX | DAX (Data Analysis Expressions) — same engine, more powerful context |
| Visualisation quality | Good; limited to built-in chart types | Excellent; 30+ built-in visuals + 100s of custom marketplace visuals |
| Cost | Included in Microsoft 365 subscription | Desktop free; Pro ~$10/user/month; Premium higher |
| Learning curve | Moderate to advanced; most professionals know basic Excel | Moderate; faster to learn with strong Excel/data model foundation |
| Best use case | Ad hoc analysis, financial modelling, individual reporting | Enterprise dashboards, live KPI monitoring, organisation-wide BI |
The honest answer: both are highly in-demand — but in different contexts. Here is what the UAE job market data actually shows:
Verdict: Excel wins for breadth (every role, every company). Power BI wins for depth and salary premium in analytics-specific roles. The strongest UAE candidates have both — which is why structured programmes that teach them together, like Alifbyte’s data analytics course, provide such strong career outcomes.
Yes — and the data backs this up clearly. Here is a realistic salary comparison between roles that require only Excel versus roles that require Power BI in the UAE:
| Role Profile | Primary Tools | Avg. Monthly Salary (AED) |
|---|---|---|
| Finance / Admin (Excel only) | Excel, basic reporting | AED 5,000 – 9,000 |
| Financial Analyst (advanced Excel) | Advanced Excel, Power Query | AED 10,000 – 18,000 |
| Data / BI Analyst (Excel + Power BI) | Excel, Power BI, SQL | AED 14,000 – 25,000 |
| Senior BI Developer / Power BI Specialist | Power BI, DAX, SQL, Azure | AED 22,000 – 38,000 |
| Data Analytics Manager | Power BI, Python, SQL, strategy | AED 35,000 – 55,000+ |
The salary jump from a basic Excel user to a dual-skilled Excel + Power BI analyst is often AED 5,000–10,000 per month — a difference that pays back course investment within the first month of a new role. For professionals ready to go further, adding data science skills in Python and machine learning pushes those numbers even higher.
Learn Excel first — then Power BI. Not because Power BI is harder, but because Excel teaches you how to think about data before Power BI teaches you how to visualise it.
Here is the specific reasoning:
The exception: if you are already proficient in advanced Excel (PivotTables, Power Query, basic DAX) and looking to move into BI-specific roles, go straight to Power BI. Alifbyte’s Power BI course is designed for exactly this transition.
The question of Power BI vs Excel is ultimately a false choice. In every high-performing analytics team in the UAE, analysts use both tools daily — for fundamentally different tasks.
Excel remains the go-to for:
Power BI is the right choice for:
The professionals earning the highest salaries in data analytics across the UAE are not those who chose one tool over the other — they are the ones who knew when to use each, and used both with expert-level skill.
Based on what UAE employers actually hire for, here is the most effective combined learning path for building Excel and Power BI proficiency:
Build this through Alifbyte’s MS Excel course — structured from foundations through to advanced Power Pivot and dashboard design.
Alifbyte’s Power BI course covers all of the above with a UAE-market focus and live project-based sessions.
Technically yes, but it is not recommended. Power BI uses the same DAX language and Power Query engine as Excel’s advanced features. Without that foundation, you will spend significantly more time learning Power BI and will likely develop gaps in your analytical thinking. Start with an MS Excel course first — particularly Power Query and basic DAX — then move to Power BI.
Power BI Desktop — the application used for building reports — is completely free to download and use. Power BI Pro (required for publishing and sharing reports in a team environment) costs approximately $10 per user per month. Most professional Power BI training courses teach you using the free Desktop version, which is sufficient for learning and building your portfolio.
Excel is better for financial modelling, scenario analysis, and complex calculations that require cell-reference-based logic. Power BI is better for live financial dashboards, multi-entity consolidations, and visual financial reporting for executive audiences. Most UAE finance professionals use Excel for building models and Power BI for presenting results and monitoring KPIs.
With a structured Power BI course and consistent practice, most learners with good Excel foundations reach professional-level proficiency in 6–10 weeks. Building competency in advanced DAX and complex data modelling typically takes 3–6 months of applied practice in real projects.
Yes — Microsoft offers the PL-300: Microsoft Power BI Data Analyst certification, which is widely recognised by UAE employers. Alifbyte’s Power BI course prepares candidates for this certification while also building applied, practical skills beyond what the exam covers.
For a data analyst role in UAE, you need both. Expect to use advanced Excel for day-to-day analysis and Power BI for dashboards and reporting. Starting with a comprehensive data analytics course that covers both tools in a structured, integrated curriculum is the most efficient path to job readiness.
Power BI is significantly more in-demand in the UAE market. Microsoft’s dominance across UAE government, banking, and enterprise sectors means that Power BI is the default BI tool for most organisations. Tableau has a presence in data-science-heavy and multinational environments, but Power BI is where UAE job market demand is strongest in 2026.
No — and it was not designed to. Power BI cannot replace Excel’s formula-based calculations, free-form modelling, or row-level data editing. They are complementary tools that serve different purposes. Organisations using Power BI extensively still rely on Excel extensively — the tools coexist in every mature analytics environment.
Alifbyte offers both a dedicated MS Excel course and a dedicated Power BI course, as well as a combined data analytics course that integrates both tools with SQL and Python into a single structured, UAE-market-aligned programme.
Build Both Skills. Earn More. Advance Faster.
The UAE’s best-paid data professionals are not Excel users or Power BI users — they are both. Start with the right course and build the complete skill set that UAE employers are actively hiring for in 2026.