If you have ever spent hours copying and pasting data from multiple files, cleaning up messy spreadsheets, or manually reformatting reports every single month — Power Query was built specifically to end that frustration. Yet it remains one of the most overlooked and underused tools in the UAE analytics toolkit. Most professionals know Excel. Most know Power BI. But very few realise that Power Query is the engine that makes both of those tools dramatically more powerful — and that learning it properly can save you hours of manual work every single week.
Table of Contents
Power Query is a data connection and transformation tool built into both Microsoft Excel and Power BI. It allows you to connect to virtually any data source, clean and reshape that data, and load it into your workbook or data model — all without writing a single line of code and without touching the original source data.
Think of it this way: before Power Query, if you received 12 monthly CSV exports from your ERP system and needed to combine them into one clean report, you would manually open each file, copy the data, fix inconsistencies, and paste it all together. That process might take two to three hours. With Power Query, you set up the transformation once — in a visual, step-by-step editor — and every subsequent month the refresh takes less than 30 seconds.
Power Query is also known by another name: Get & Transform, which is how it appears in Excel’s Data ribbon since Excel 2016. Despite the different name in Excel, it is the same technology — and the skills transfer directly between Excel and Power BI.
It is not an exaggeration to say that Power Query is the single biggest productivity multiplier available to data professionals working in Excel and Power BI today. It is the reason experienced analysts at Alifbyte consistently recommend completing a dedicated Power Query course before advancing into Power BI or complex data modelling work.
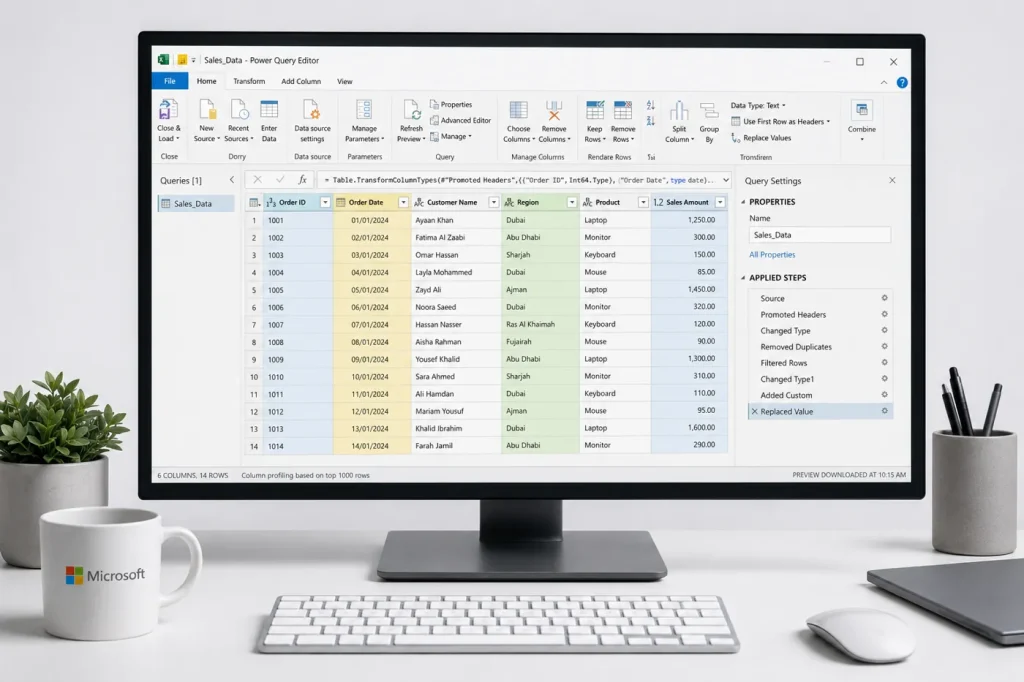
Power Query works through a visual, step-based editor. Every action you take — connecting to a file, removing a column, changing a data type, filtering rows — is recorded as a discrete step in the Applied Steps pane. This creates a reproducible, auditable transformation pipeline that runs automatically every time you refresh the query.
Here is the basic workflow:
Behind the scenes, Power Query generates M code (also called the M formula language) for every transformation step. You do not need to write M code to use Power Query — the visual interface generates it for you. But learning the basics of M unlocks advanced capabilities for complex transformations that go beyond what the visual editor provides out of the box.
This combination of visual accessibility and underlying code power is what makes Power Query suitable for everyone from a junior analyst handling monthly reports to a senior BI developer building enterprise data pipelines.
Power Query exists in both Excel and Power BI, and the core engine is identical. However, there are practical differences in how it is accessed and used in each application:
| Feature | Power Query in Excel | Power Query in Power BI |
|---|---|---|
| Where to access | Data ribbon → Get & Transform Data | Home → Transform Data in Power BI Desktop |
| Editor interface | Identical Power Query Editor window | Identical Power Query Editor window |
| Data output destination | Excel Table, worksheet, or Power Pivot model | Power BI data model only |
| M code language | Same M language — skills are fully transferable | Same M language — skills are fully transferable |
| Refresh options | Manual refresh or on file open | Scheduled automatic refresh via Power BI Service |
| Dataflow support | Not available | Power BI Dataflows — reusable cloud-based queries |
| Best used for | File-based ETL, monthly reports, Excel dashboards | Enterprise BI, live dashboards, multi-source models |
The practical implication for UAE professionals: learn Power Query in Excel first. You will use it daily in Excel-based workflows immediately, and when you are ready to move into Power BI, your Power Query skills carry over completely — giving you a significant head start in building Power BI data models.
Power Query’s transformation library is extensive. Here are the most commonly used and highest-value capabilities for UAE analysts:
The UAE business environment has specific characteristics that make Power Query especially valuable:
💡 Key Insight
In the UAE, professionals who add Power Query to their Excel skill set report saving an average of 5–10 hours per week on manual data work. Over a year, that translates to 250–500 hours reclaimed for analysis, reporting, and higher-value tasks. That is the real career ROI of a Power Query course.

The best way to understand the value of Power Query is through the specific problems it solves in UAE business contexts. Here are five representative scenarios:
A Dubai retail chain receives daily sales exports from its POS system as separate CSV files — one per store, one per day. Manually combining 30 files × 15 stores every month is a full-day task. With Power Query, a folder connection imports and appends all files automatically. The monthly report refreshes in under a minute.
A UAE finance team exports transaction data from their accounting software and needs to reconcile it against their VAT return in a specific FTA format. The source data has inconsistent VAT codes, wrong date formats, and missing supplier details. Power Query automates the cleaning, standardisation, and reformatting — making what was a manual 4-hour process a 10-minute automated refresh.
An Abu Dhabi company’s HR team pulls monthly headcount data from their HRMS into Excel. The data arrives with employee names split across two columns, departments using inconsistent naming, and salary figures stored as text. Power Query merges name fields, standardises department names, converts data types, and loads a clean table directly into a headcount dashboard — zero manual manipulation required.
A BI analyst building a sales performance dashboard in Power BI needs to combine data from three sources: a SQL database, a SharePoint Excel file, and a third-party API export. Power Query handles the connection, transformation, and merging of all three sources before the data ever reaches the visualisation layer. The result is a reliable, refreshable data model with no manual intervention between source and dashboard.
A UAE financial planning team receives budget submissions from 8 business units in slightly different Excel template formats. Power Query normalises all eight files into a single consistent structure, appends them, and loads the consolidated dataset into the master budget model — eliminating the most error-prone step in the entire budgeting cycle.
Many experienced Excel users have historically used VBA macros to automate data tasks. Power Query is not a replacement for VBA — they solve different problems — but for the majority of data transformation and consolidation tasks, Power Query is the better choice for UAE professionals in 2026. Here is why:
| Criteria | Power Query | VBA Macros |
|---|---|---|
| Learning curve | Low — visual, no-code interface | High — requires programming knowledge |
| Maintenance | Easy — steps are visible and editable | Difficult — code requires developer to modify |
| Transferability to Power BI | Direct — same M language and interface | None — VBA does not work in Power BI |
| Data source connectivity | 300+ native connectors built in | Limited to what Excel can open natively |
| Audit trail | Every step is named and visible | Code must be read and interpreted |
| Interaction automation | Data transformation only | Can automate UI actions, send emails, interact with other applications |
| Best for | Data import, cleaning, and transformation workflows | Complex process automation, custom UI, legacy workflows |
Bottom line: For UAE data and finance professionals whose primary goal is faster, more reliable reporting — Power Query is the right tool to learn first. VBA remains valuable for process automation but is harder to learn, harder to maintain, and has no pathway into Power BI. If your long-term goal includes building a full data analytics skill set, Power Query is the right investment.
Power Query is learnable by anyone with basic Excel familiarity — even without a technical background. Here is the most effective path to building genuine Power Query competency:
Power Query makes more sense when you understand what you are transforming and why. A solid grounding in Excel data structures, tables, PivotTables, and basic formula logic makes every Power Query concept click faster. Alifbyte’s Advanced MS Excel course provides this foundation, including an introduction to Power Query and Power Pivot within the Excel environment.
While Power Query is often taught as a module within broader Excel or Power BI courses, a dedicated Power Query course gives you the focused depth that an introductory module cannot. You need to understand M code basics, handle errors confidently, work with folder connections, and build complex merge and append workflows — not just perform simple column removals.
Power Query is a tool you learn best by doing. Identify one recurring, manual data task in your current role — a monthly consolidation, a report reformatting process, a data cleanup routine — and rebuild it in Power Query. Real application accelerates learning more than any amount of tutorial watching.
Once you are comfortable with Power Query in Excel, the transition to Power BI is straightforward. The same editor, the same transformations, the same M language — just with a more powerful visualisation and sharing layer on top. Alifbyte’s Power BI course picks up exactly where your Power Query foundation leaves off.
Power Query + Power BI + SQL + basic Python forms the core toolkit of a mid-level data analyst in the UAE job market. Professionals who build this stack systematically — rather than jumping between tools randomly — consistently outperform those who have surface-level familiarity with many tools. Alifbyte’s full data analytics courses are structured to guide this exact progression.
Yes — Power Query is included in Microsoft Excel 2016 and later (Windows), all Microsoft 365 subscriptions, and Power BI Desktop (which is free to download). There is no additional cost to access or use Power Query if you already have Excel or Power BI Desktop installed.
No — Power Query is designed as a no-code, visual tool. Every transformation is applied through a graphical interface with point-and-click steps. The M code it generates behind the scenes is visible and editable, but you can become highly proficient without ever writing M directly. A structured Power Query course will teach you the visual interface thoroughly and introduce M code concepts progressively as you advance.
Power Query handles the extraction, transformation, and loading (ETL) of data — connecting to sources, cleaning, reshaping, and loading data into your model. Power Pivot handles the data modelling and calculation layer — creating relationships between tables, writing DAX measures, and building the data model that formulas and visualisations reference. They work as a team: Power Query prepares the data, Power Pivot analyses it. Both are available in Excel, and both power the data layer in Power BI.
Yes — Power Query can connect to most accounting software used in the UAE through various methods. Direct connectors exist for QuickBooks Online, Xero, and Salesforce. For software like Tally, Sage, or SAP, data is typically exported as CSV or Excel and then loaded via Power Query. ODBC connections allow direct database access for more advanced setups. This makes Power Query highly practical for UAE accounting and finance professionals handling data from multiple systems.
VLOOKUP is a formula that looks up a single value from another table. Power Query’s Merge Queries feature does what VLOOKUP does — but for entire tables, with multiple join types (left outer, inner, full outer), with no size limitations, and without the fragility of formula-based lookups. If you are using VLOOKUP to combine two large datasets, Power Query’s merge is faster, more reliable, and infinitely more scalable.
Significantly. Power Query is the data transformation engine inside Power BI. Every skill you build in Power Query — transformations, M code, folder connections, merge and append logic — applies directly in Power BI Desktop. Analysts with strong Power Query foundations consistently build cleaner, more reliable Power BI data models in less time. It is the reason Alifbyte recommends Power Query as a prerequisite before the Power BI course.
M (formally called the Power Query Formula Language) is the functional programming language that Power Query uses to define data transformation steps. When you click “Remove Duplicates” or “Change Type” in the visual editor, Power Query writes an M expression behind the scenes. You can view and edit this M code in the Advanced Editor. Basic M knowledge allows you to write custom transformations beyond what the visual interface provides — such as dynamic date ranges, conditional logic across columns, or custom function creation.
With a structured approach and consistent practice, most professionals with basic Excel familiarity can become functionally proficient in Power Query in 3–5 weeks. Reaching advanced competency — including M code, folder connectors, and complex merge/append workflows — typically takes 2–3 months of regular application to real work projects. A dedicated Power Query training course compresses this timeline significantly compared to self-study.
Yes — Power Query handles large datasets far more efficiently than standard Excel worksheets. When data is loaded into the Excel Data Model (Power Pivot) rather than a worksheet, the in-memory columnar storage engine compresses and processes data at a scale that would crash a normal worksheet. In Power BI, the same engine handles hundreds of millions of rows. For very large data engineering requirements, Power Query serves as an effective lightweight ETL layer before more specialised tools like Azure Data Factory or Python-based pipelines become necessary.
Alifbyte Educational Institute offers a dedicated Power Query course in UAE with hands-on, project-based training designed specifically for finance, accounting, and data analytics professionals in the region. The course covers everything from basic transformations to advanced M code, folder automation, and integration with Power BI. Live sessions are available in both Dubai and Sharjah branches, with flexible scheduling for working professionals.
Stop Doing Manually What Power Query Can Do in Seconds
Every hour you spend copying, pasting, and reformatting data is an hour you are not analysing, presenting, or growing your career. Power Query is the tool that changes that — and Alifbyte will teach you to use it properly.
→ Enrol in the Power Query Course
→ Advanced MS Excel Course (includes Power Query foundations)